The Federal budget is a reflection of national priorities with regard to spending, transfers and acceptance of taxes to support this expenditure. At times, the budget may be used as a tool to affect the aggregate economy -- the use expansionary fiscal policy to combat recessionary pressures. However, in times of budget deficits, these fiscal expansions make existing deficits worse and add to the national debt -- debt, that in some proportion to GDP may not be financially sustainable. Additionally, deficit spending has the effect of making the public provision of goods and services relatively cheaper when compared to privately provided goods. In reality this is just a temporal shift of the costs to a later date with benefits being realized in the present.
High existing levels of government debt can nullify the availability of fiscal policy as an active policy tool. The burden for expansionary policies, when required, fall on monetary authorities.
| Year | NGDP ($ billions) |
Budget Deficit ($ billions) |
Federal Debt ($ billions) |
Debt as a % of NGDP |
Interest on the debt ($ billions) |
Interest as a % of NGDP |
| 1975 | 1,688.92 | 53.24 | 543.29 | 32.1 | 23.2 | 1.37 |
| 1980 | 2,862.51 | 73.83 | 894.74 | 31.3 | 52.5 | 1.83 |
| 1985 | 4,346.74 | 212.31 | 1,813.60 | 41.7 | 129.5 | 2.98 |
| 1990 | 5,979.58 | 221.04 | 3,198.46 | 53.5 | 184.4 | 3.08 |
| 1995 | 7,664.06 | 163.95 | 4,944.53 | 64.5 | 232.1 | 3.03 |
| 2000 | 10,284.78 | -236.24* | 5,698.93 | 55.4 | 223.0 | 2.17 |
| 2005 | 13,093.72 | 318.35 | 7,929.14 | 60.6 | 184.0 | 1.41 |
| 2010 | 14,964.38 | 1,294.37 | 13,390.44 | 89.5 | 196.0 | 1.31 |
| 2015 | 18,120.71 | 438.50 | 18,344.21 | 100.1 | 223.0 | 1.23 |
| 2019 | 21,427.69 | 983.5 | 22,499.1 | 105.0 | 273.5* | 1.27* |
Source: St. Louis Federal Reserve (FRED 11-2017) and https://www.thebalance.com/interest-on-the-national-debt-4119024, *note: the negative value for 2000 represents a budget surplus. [* 2019 estimates]
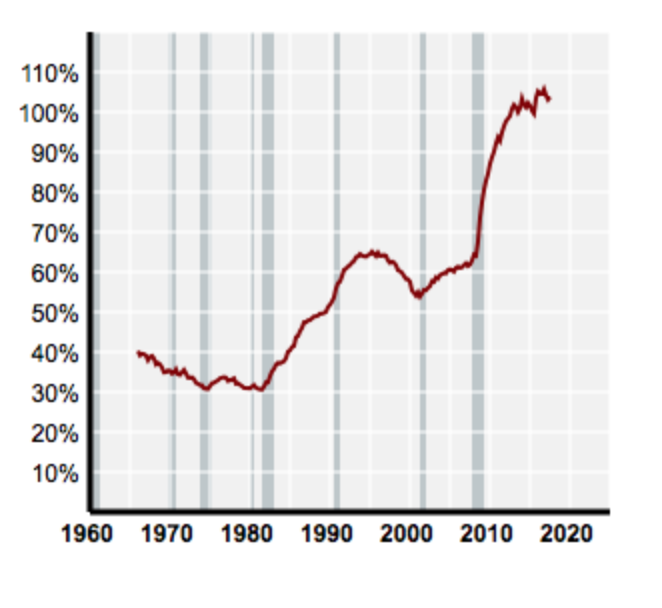
In looking at the table above, we find that in the U.S. the ratio of Federal Debt (a nominal measure) to Nominal GDP has risen from roughly 30% in 1975 to just over 100% in 2015. The rapid increase in deficit spending in 2010 and in the overall debt in 2010 is a reflection of a fiscal response to the financial crisis of 2008-2009.
Changes and policy implications of the Debt-NGDP ratio is best understood by analyzing the following expression.
Debtt = Deficitt + (1 + i)Debtt-1
In words, the Debt (a stock variable) at the end of time period 't' is equal to any deficit spending (a flow variable) in that time period plus the interest expense on past debt that accrues at some nominal rate 'i'.
If the right-hand side of this value is growing faster than growth in Nominal GDP, then the ability to service this debt, at some point in time, becomes problematic. Specifically if the nominal interest rate on the debt is greater than the growth rate in NGDP, there is some point where supporting this debt is no longer sustainable. Lenders would no longer be willing to finance future deficits and/or the interest burden on existing debt begins to dominate the federal budget.
Debtt = Deficitt + Debtt-1 + i x Debtt-1
Debtt - Debtt-1= Deficitt + i x Debtt-1
ΔDebtt = Deficitt + i x Debtt-1
which might be viewed as unsustainable if:
Deficitt < i x Debtt-1
That is, if current deficits are dominated by the interest expense of servicing existing debt.
The reality in recent history is that the large deficits and accumulating debt have not worsened the interest burden. The financial crises of 2008 was accompanied by lower interest or borrowing rates such that interest on the debt as a percentage of NGDP in 2019 is roughly a third the amount of 1990.